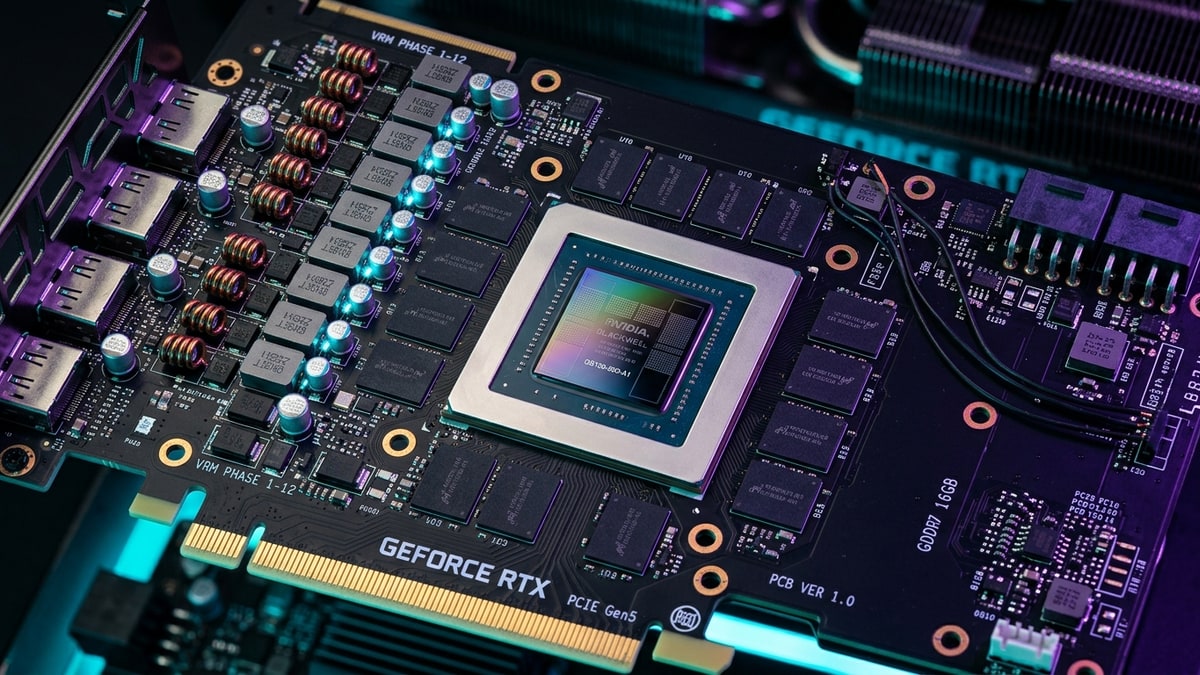
Most RTX 50 cards ship fed more voltage than their silicon needs, because NVIDIA calibrates the curve for the worst chip it will sell — not yours. Undervolting through MSI Afterburner’s curve editor reclaims that margin: community-measured results show roughly 30W saved on an RTX 5070 up to around 100W on an RTX 5090, with sustained clocks held flat and frame rates unchanged at the end of it.
This walkthrough covers the whole job: baseline, voltage targets per card, curve editing, and the testing loop that separates a stable daily profile from a screenshot.
What changed
Undervolting is not new, but the RTX 50 series made it newly relevant for three reasons:
- Power budgets went up. NVIDIA’s official spec sheets list total graphics power of 575W for the RTX 5090, 360W for the RTX 5080, 300W for the RTX 5070 Ti, and 250W for the RTX 5070. More watts at stock means more watts recoverable per millivolt of voltage reduction — power draw scales with the square of voltage, so the biggest cards see the biggest savings.
- The tooling caught up. MSI Afterburner 4.6.6 was the first stable build with official GeForce RTX 50 support, along with support for up to four independent fans and an extended memory offset range that pairs naturally with GDDR7 headroom. Earlier stable builds predate Blackwell entirely, so version selection is not optional.
- The market rewards keeping cards. With GPUGPU. Graphics Processing Unit — the chip that renders the game's visuals; the main driver of framerate and image quality. and memory pricing where it is in 2026, a card that runs cooler and holds its boost clock longer is also a card you replace later.
There is also a shift in defaults worth noting: undervolting has largely replaced overclocking as the first tweak enthusiasts make, because the return — lower temperatures, quieter fans, same or slightly better sustained performance — costs nothing and risks almost nothing. The worst realistic failure is a driver crash that a 25mV voltage bump fixes.
How it works
Blackwell GPUs, like every NVIDIA generation since Turing, boost along a voltage-frequency curve: for each voltage level, the firmware allows a maximum clock. At stock, the card moves up and down that curve chasing the highest clock its thermal and power limits permit — typically settling around 900mV to 1,050mV and 50 to 100MHz below the advertised boost clock under sustained load. NVIDIA’s official boost clocks (2.41GHz on the 5090, 2.62GHz on the 5080, 2.51GHz on the 5070) describe where the curve tops out, not where your card lives during a long session.
Undervolting pins one point: a lower voltage, at the clock your card already sustains, with everything to the right flattened so the GPU cannot climb back up the expensive end of the curve.
The tools: download MSI Afterburner only from msi.com or guru3d.com — mirror sites bundle modified installers. RTSS, the on-screen overlay, installs with it. Add HWiNFO64 in sensors-only mode for power, junction temperature, and clock history.
Step 1 — Baseline. Before touching anything, run a repeatable GPU load for 10 to 15 minutes — a demanding game section or a benchmark loop — and record sustained core clock, sustained core voltage, total board power, and junction or hotspot temperature. Run it twice so you know your run-to-run variance; a 2 percent gain in a test with 3 percent noise is not a gain.
Step 2 — Open the curve editor. In Afterburner press Ctrl+F. The horizontal axis is voltage in millivolts; the vertical is core clock in megahertz. The rising staircase is your stock curve.
Step 3 — Pick a target and drag. Find the point at your target voltage, drag it up to your target clock, then select every point to the right of it and drag the group down to the same height. That flat shelf is the part most first-time tunes forget, and without it the card simply boosts past your lock and nothing changes. Click Apply.
Step 4 — Test, step, repeat. Run your real workload. Stable — same clocks, lower power? Step the voltage down 12.5 to 25mV and test again. Crash or black screen — the silicon needs more voltage for that clock; step back up. Three rounds usually finds the floor.
Community-consensus starting points, drawn from hardware forums, review sites, and curated tuner databases, cluster tightly:
| Card | Starting voltage | Target clock | Community-measured saving |
|---|---|---|---|
| RTX 5090 | 0.900V | ~2,800MHz | ~100W, ~10°C cooler, FPSframerate. How many images (frames) the game shows per second; higher = smoother motion. 60 fps is a common target. parity or within ~2% |
| RTX 5080 | 0.900–0.950V | ~2,800–2,900MHz | ~50–70W, up to 8°C cooler |
| RTX 5070 Ti | 0.925V | ~2,800MHz | ~35–50W |
| RTX 5070 | 0.900V | ~2,900MHz | ~30W, ~7°C cooler |
Treat every row as a starting point, not a target. Silicon varies by 25 to 50mV between otherwise identical cards.
On stress testing: agree with the community consensus that synthetic torture tools alone are not proof. FurMark slams the power limit and pushes the card off your locked point on the curve, so it can pass a bad undervolt; the demanding games you actually play — especially ray-traced and path-traced titles, which hit different transient voltage patterns — are the validation that matters. Budget 30 minutes minimum in real games, then a longer evening session, before trusting the profile.
Step 5 — Persist it, carefully. Save the curve to an Afterburner profile slot, but do not tick “Apply overclocking at system startup” until the profile has survived roughly a week of real use. An unstable profile applied at boot is the one failure mode that costs an evening instead of a minute. Keep a stock profile saved alongside it for troubleshooting, and retest after major driver updates, since NVIDIA driver releases can shift boost behavior.
Optional extras, after the core tune is stable: build a custom fan curve off the improved temperatures (silence below roughly 60°C junction, gradual ramp after), and consider modest GDDR7 memory offsets as a separate experiment — core voltage and memory clocks are independent, so they can be tuned sequentially, never simultaneously.
What it means
For the 5090, this is nearly free money. Pulling around 100W off a 575W card at identical frames cuts heat, noise, and the electricity math — at U.S. average residential rates, 50W saved over heavy daily use is roughly a couple of dollars a month, and more at California-tier pricing. More importantly, the card stops bouncing off its power limit, which is where the occasional small FPS gain on long sessions comes from.
For the 5080 and below, the payoff is acoustics and consistency more than the watt count. A 5080 holding 2,750MHz at 950mV instead of hunting near 1,000mV runs meaningfully quieter, and partner cards with headroom-heavy coolers often need less voltage at a given clock than compact designs.
On warranty and safety: undervolting reduces electrical and thermal stress below stock and lives entirely in software — it resets on reboot if you want it to. It has not historically been treated as warranty-relevant the way raising voltage is. The one discipline that matters is the one above: never set an unproven profile to apply at Windows startup.
The limit to keep in mind: undervolting manages heat at the source, but it is not a substitute for airflow. A 5080 gasping in a case with one intake fan will throttle regardless of its curve; fix the case first, then tune. And if your goal is more frames rather than cooler frames, this is the wrong tool — it preserves performance while cutting power; it does not add peak.
Three profiles is the tidy end state: stock for troubleshooting, a conservative daily undervolt you trust, and a test slot for experiments. The best undervolt is the one stable enough that you eventually forget it exists.